
Scope
The Quantum Entropy Source (QES) generates, measures and publishes physical entropy from radioactive decay, a process whose timing is unpredictable in principle, not for lack of knowledge.
The point is quantified entropy, not random-looking numbers: the system counts physical events, assesses their entropy offline against NIST’s estimators, conditions the output with standard cryptography, and shows the count rate and the health of the source on a live dashboard.
The goal is an auditable, openly observable entropy source for research and for integration into other systems.
Theory
In this project, entropy is used in the information-theoretic and cryptographic sense:
Entropy is a quantitative measure of the unpredictability of a physical process.
The system derives entropy from the timing uncertainty of radioactive decay events, a process governed by quantum mechanics and widely accepted as fundamentally unpredictable.
Cryptographic conditioning (SHA-256, HMAC) makes the output uniform; it cannot add entropy.
- Entropy resides in the physical process, not in the output bits
- Output bitstreams carry entropy only if extraction is done correctly
- Entropy is quantified conservatively using min-entropy bounds
System overview
Physical entropy source
- Naturally occurring radioactive material, sealed in a ceramic matrix
- Decay events detected using Geiger-Müller tubes
- High-resolution hardware timers capture event timestamps
- Timing jitter and arrival statistics form the raw entropy source
The radioactive material is fixed, non-dispersible, and continuously monitored. External radiation exposure remains comparable to natural background levels.
Entropy processing pipeline
- Event detection (decay triggers)
- High-resolution timestamp capture
- Raw entropy estimation
- Health monitoring and interference detection
- Cryptographic conditioning
- Distribution and visualization
Operational safety and transparency
Operational safety is treated as a first-class design requirement.
- Radiation levels are continuously monitored
- Alpha radiation remains fully contained within the material matrix
- The radioactive material is not accessible during normal operation
Standards
The design follows the NIST recommendations for random number generation (SP 800-90 series). The standard defines how a physical entropy source has to be documented, monitored and measured — we apply it end to end:
- Source (SP 800-90B) — NIST’s own
ea_iidandea_non_iidestimators on 3.0 million 8-bit symbols, each the low byte of an inter-event tick difference: 7.92 bits of min-entropy per symbol on the IID track, which the suite’s 10 000 permutation tests justify, with 7.03 as the conservative non-IID floor. Assessed in 2026-08 on v1 data captured in 2026-01; the equivalent run on v2 hardware has not been done. The tools’ unedited output is published - Conditioning and combination (SP 800-90A, 800-90C) — a standard HMAC-based generator, with the physical source feeding every output bit. Neither has been assessed against the standard, and we publish nothing for either
Formal certification by an accredited lab is a planned milestone. Two of the claims above come with the artefact behind them: the min-entropy assessment is published as the assessment tool’s own unedited output, and the positive-control results below come with the raw bytes and a script that recovers their numbers from those bytes. The rest of the figures on this page — the conditioning test vectors, the full-entropy construction, the clock and battery specifications, the dose statements — are stated on our authority with nothing published to check them against, and should be read that way.
The symbol assessed is the low byte of an inter-event interval, so that figure is an entropy budget conditional on decay timing being unpredictable, rather than a demonstration of it. Run on a record made by a pulse generator with no decay in it at all, the same estimators give 7.22 bits against the decay source’s 7.92 — and on the conservative track the generator wins, 7.10 against 7.03. That run is published with the tools’ own output, so the limit can be checked rather than taken.
Development roadmap
V1 prototype
The V1 system demonstrates end-to-end entropy generation, monitoring, and dissemination.
- Radioactive decay as the entropy source
- Single Geiger-Müller counter
- 7.92 bits of min-entropy per 8-bit timestamp symbol, assessed with NIST’s own SP 800-90B estimators on 3.0 million symbols — 350–400 bit/s at typical count rates
- Basic health monitoring
- Real-time data output
- Public dashboard access
V1 architecture
The architecture separates physical sensing, entropy estimation, conditioning, storage, and presentation into independent modules to allow verification and future scaling.
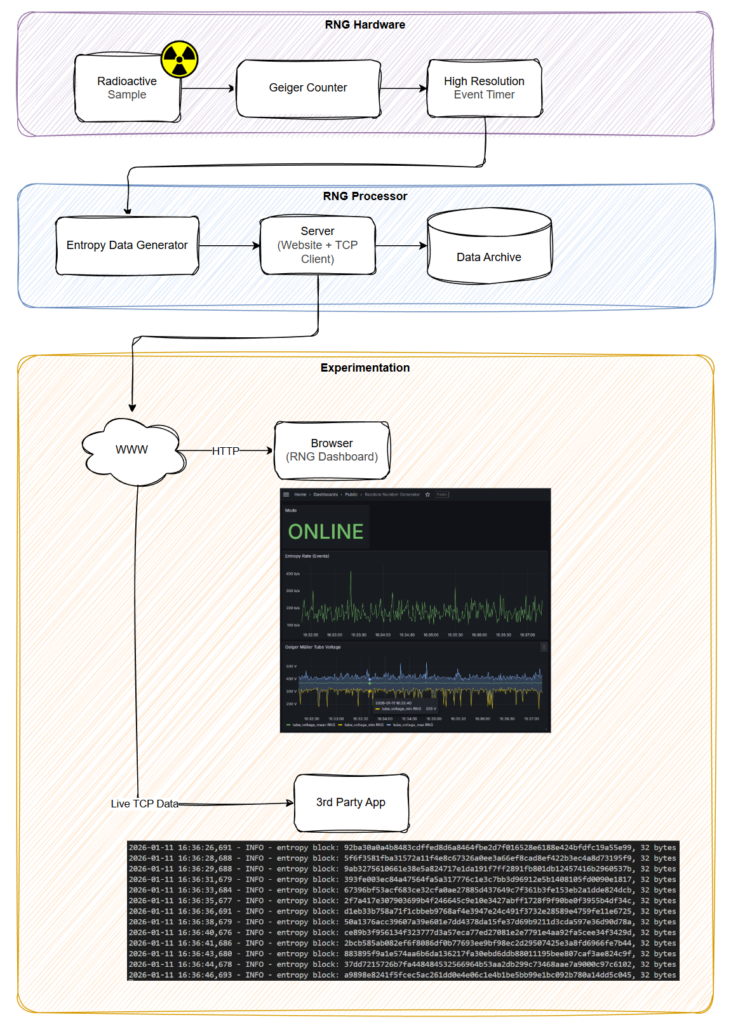
Live dashboard
The live dashboard exposes the internal state of the system in real time, including:
- Event rate
- Entropy rate, as the event rate multiplied by a fixed figure — see the note below
- Tube voltage, and the entropy delivered per day
The dashboard is at rng.nolle.engineering and is open without a login. Note on its entropy figure: it multiplies the live event rate by 7.9 bits per event rather than estimating entropy live, so anything that raises the count rate — contamination, interference — raises the number it shows. The entropy assessment is made offline on recorded data.
V2 development prototype
V2 is the prototype on our bench today. It carries the electronics of the field unit — three Quantum Entropy Modules, hardware timestamping and the clock assembly — and is where the design is being qualified.
- Three independent Quantum Entropy Modules — each source and tube in its own shielded aluminium enclosure
- About 1 kbit/s from three modules at the present source loading, which is roughly 130 events per second
- Clock assembly — atomic clock, GPS-disciplined oscillator and GNSS timing receiver
- Cross-module correlation monitor
- Tamper-evident recording — the encoded byte stream is written to two sinks, the card and the link, from one encoder, so they are copies of each other rather than independent measurements; the hash chain and its signatures are what make either verifiable
- Continuous self-tests — the health of each source is watched while it runs
Precision timebase. Events are timestamped on a 150 MHz counter, so the quantisation step is 6.7 ns — a step size, not a timing accuracy, and far smaller than the detector’s own contribution. The clock assembly carries a rubidium frequency standard, a GPS-disciplined oscillator and a satellite timing receiver so that the three can be compared against one another continuously and their offsets recorded. None of that has yet been demonstrated on a published record: in every record we have published the receiver had no fix, so no record here is tied to UTC at all. We do not claim metrological traceability — that needs an unbroken chain of calibrations with a stated uncertainty at each link, and we have published none — and the clock assembly’s own stability figures are not published either.
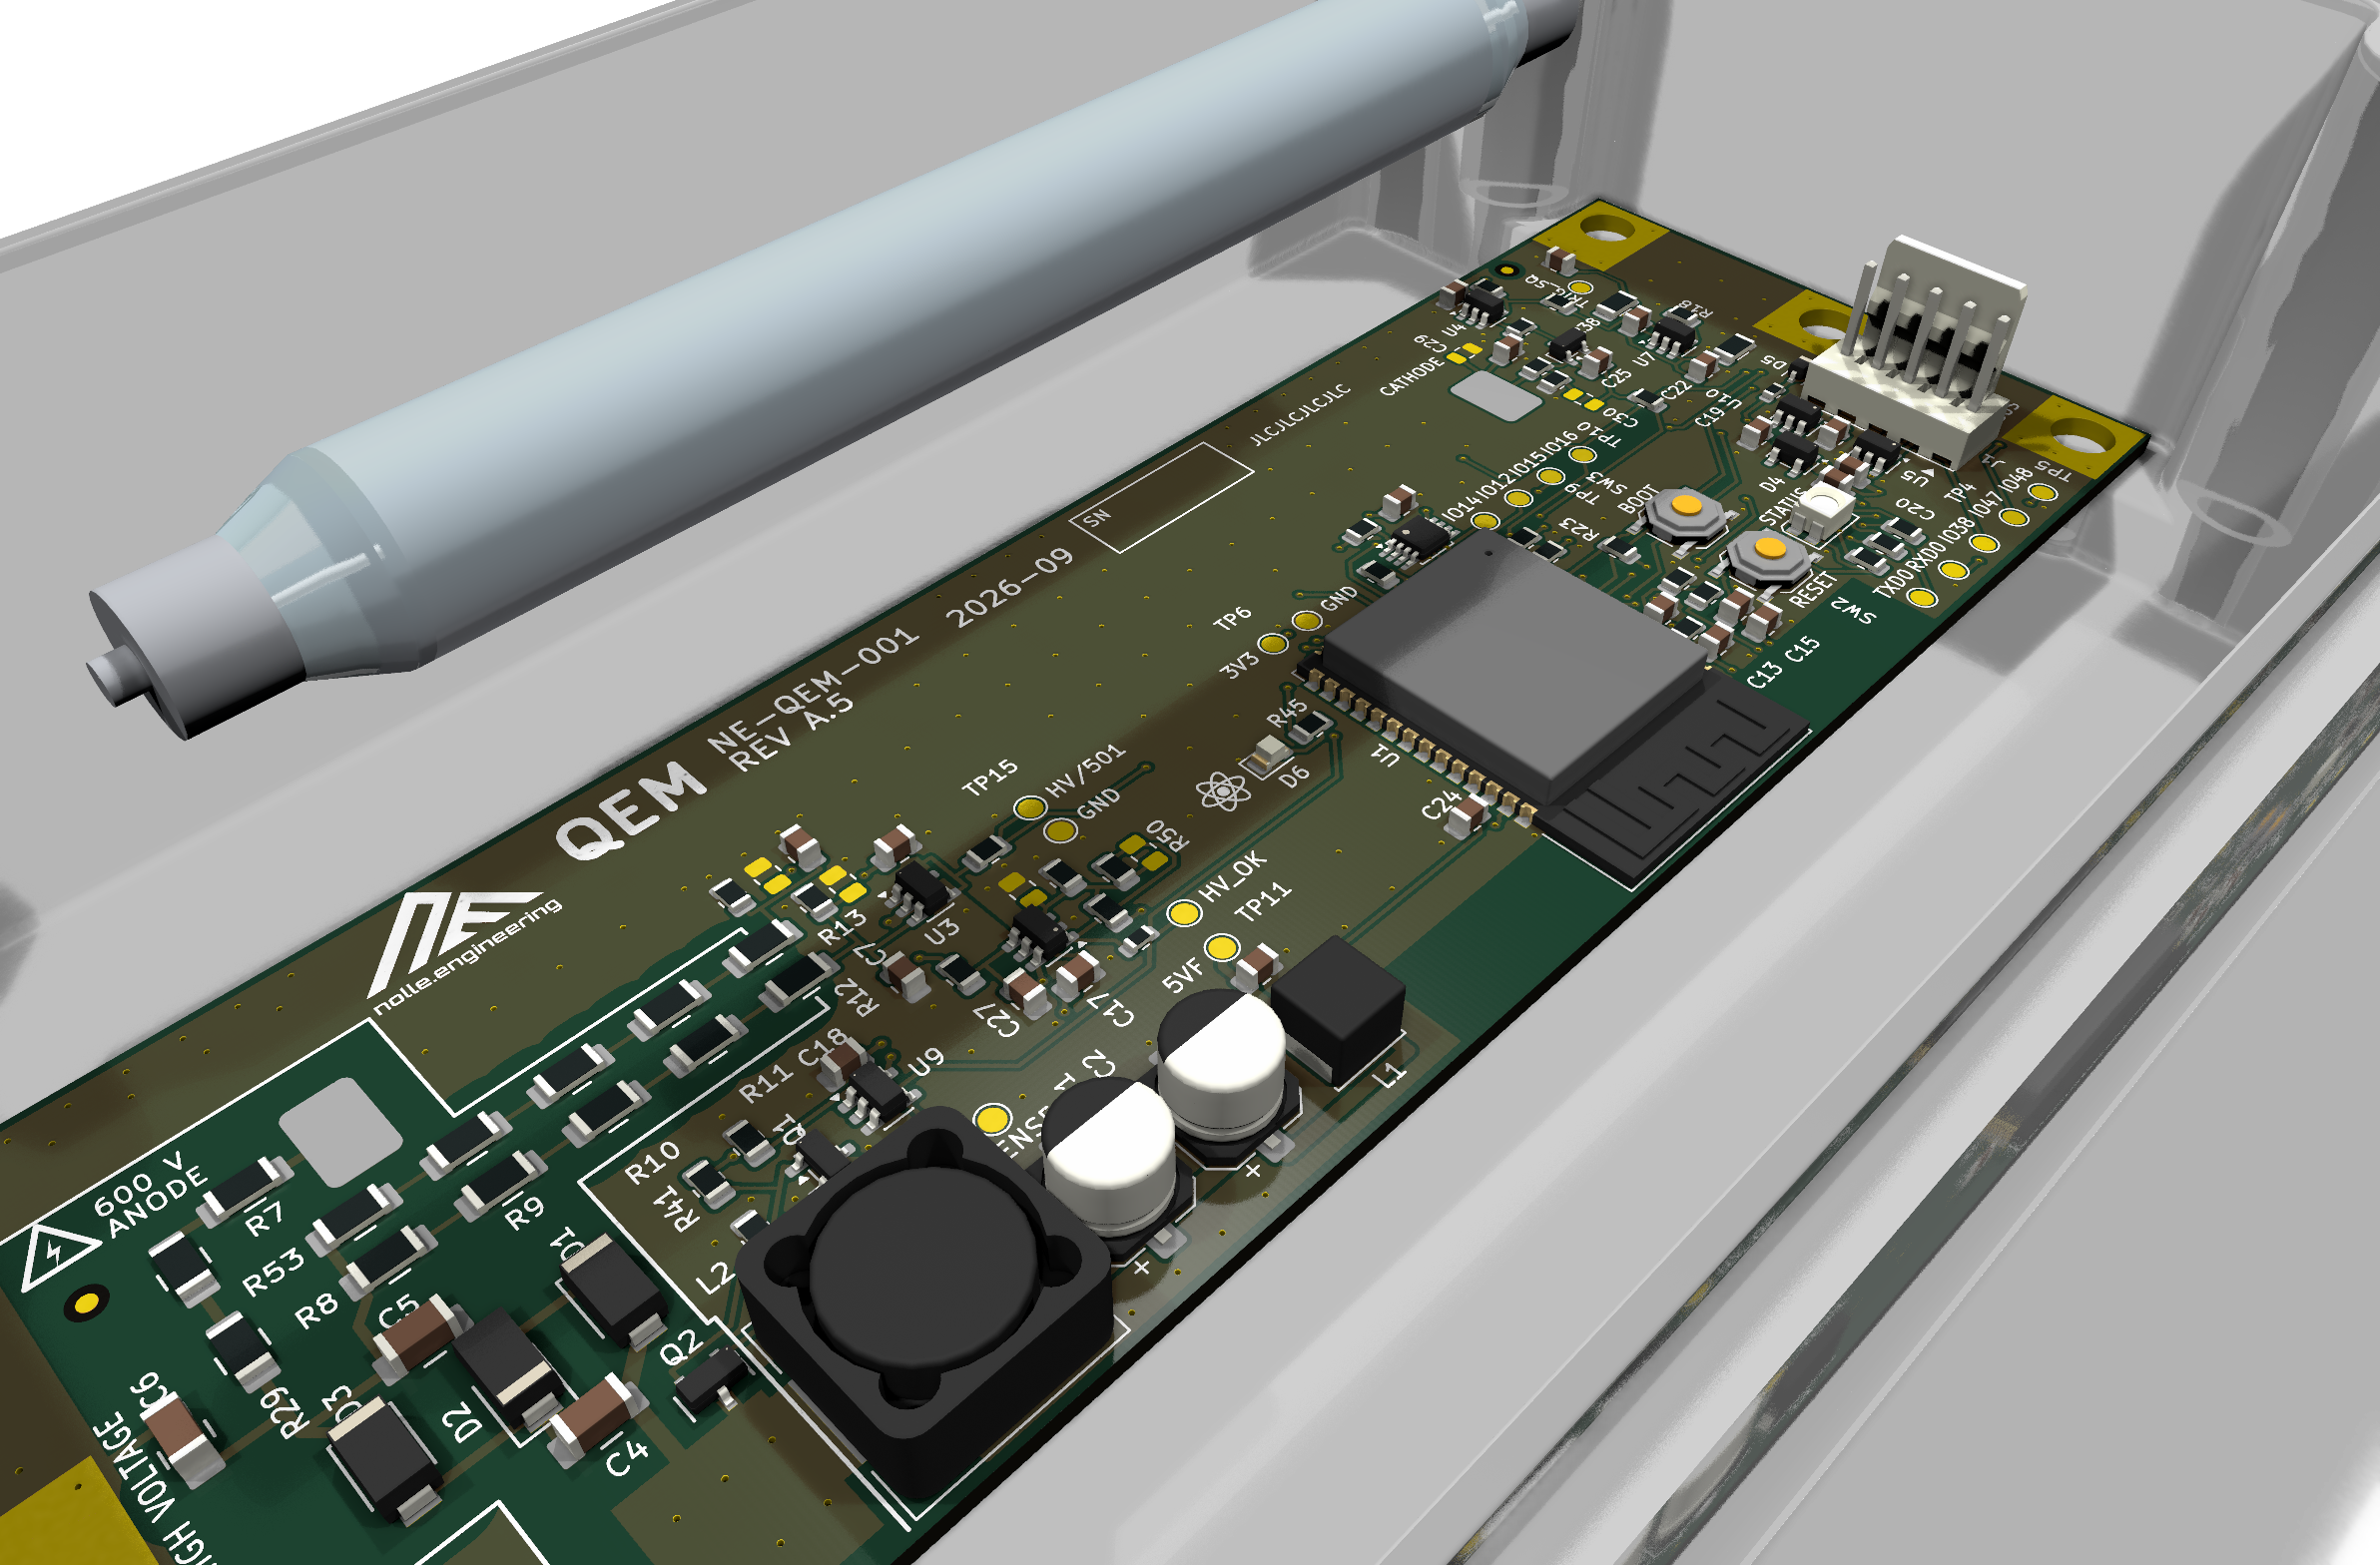
V3 field unit (QES-3)
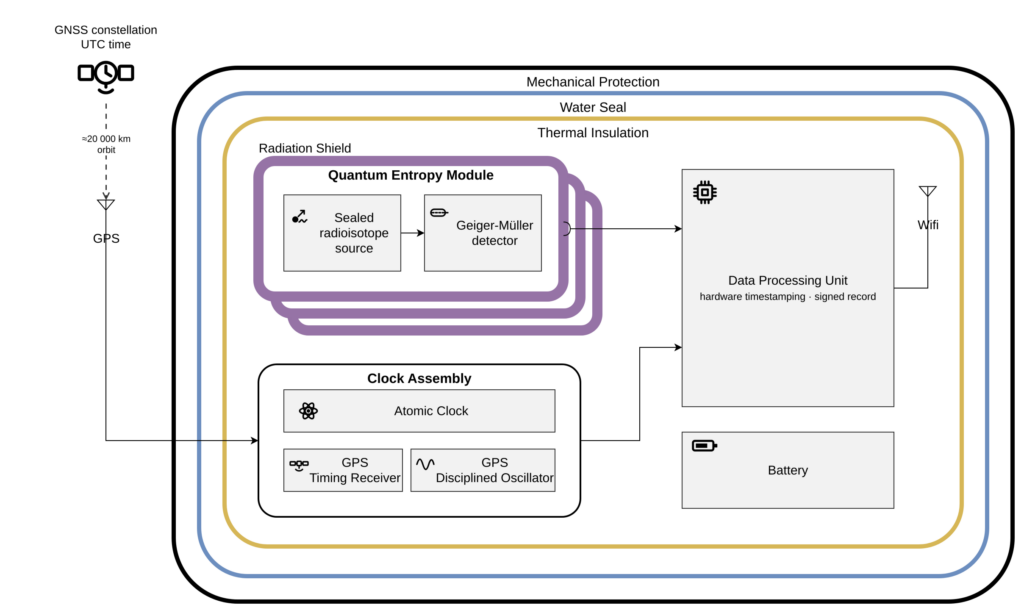
V3 packages the V2 electronics into a field unit that runs unattended, remotely or on site, and records everything it measures. It is designed and not yet built. The electronics are the ones running on the bench today; the sealed enclosure, the shield and the source assembly exist as a design study, and building them is project work rather than something we have on a shelf. The images below are from that study.
- Ruggedized, sealed case — mechanical protection, water seal and thermal insulation
- Radiation shield — around the three modules
- Battery operation — then site power
- Wireless link — live data and remote access
V3 architecture


Verifiable records
Every instrument signs what it records, as it records it. At intervals it emits an anchor carrying a SHA-256 hash chained over every byte written since the last one, and a secure element signs that anchor with a key generated on its own die. A published record can therefore be checked by anyone, against public keys alone, with no part of the check resting on our word.
Checking one takes a single file and a Python interpreter:
curl -O https://gitlab.nolle.engineering/qes/tools/-/raw/main/qes.py
git clone https://gitlab.nolle.engineering/qes/records.git
python3 qes.py verify records/qualification/20260921T074905Z_null/capture.pkt --pubkey 04b92e…
Exit status 0 means the chain holds, every signature verifies, the secure element’s counter is consistent and the byte offsets match the file. --tamper-test flips a bit and shows where it is caught. Each record also carries a proof that its hash was committed to a public blockchain, so the date it existed by is checkable without trusting us.
What the signature covers. A recording starts and stops between anchors, so a prefix and a tail of each file sit outside the chain — 30.6 %, 6.9 % and 13.7 % of the three records published. The verifier prints the covered range and the analysis can be restricted to it; sealing a record end to end needs a firmware change we have not made.
Measured performance
Every figure below comes with the data behind it in the public dataset.
| what | measured | on |
|---|---|---|
| Event timestamp resolution | 6.7 ns quantisation step, hardware capture | 150 MHz counter |
| Timestamp fidelity against an external schedule | 1.9–2.4 ns RMS, unchanged under load | qualification campaign |
| Event accounting | exact — sent equals archived, event for event | 2.4 M events per channel, 2 h 40 m |
| Clock stability | 7×10⁻¹⁰ at 128 s; drift-dominated beyond | 12 h continuous |
| Source count-rate stationarity | Fano 0.947–0.957 at 1 s; nothing above Poisson anywhere | 3 h of real decay |
| Min-entropy per 8-bit symbol | 7.92 (IID track), 7.03 conservative floor | 3.0 M symbols, NIST SP 800-90B |
| Detection sensitivity | ε = 0.003 recovered at z = 17 in 16 min | signed positive control |
Detection sensitivity, in full
An instrument that reports no effect is only interesting if it would have reported one that was there. A known bias ε is injected into the timing of the events and the analysis is asked to recover it. Each interval becomes one bit, 1 if it is longer than the running median of the previous 64 on that channel; ε̂ is the pooled proportion of ones minus one half.
| injected ε | duration | bits | recovered ε̂ | σ | z |
|---|---|---|---|---|---|
| 0.01 | 87 s | 66 027 | +0.00923 | 6.3×10⁻⁴ | +14.5 |
| 0.003 | 16 min | 797 319 | +0.00298 | 1.7×10⁻⁴ | +17.3 |
| 0 (null) | 12 min | 625 488 | −0.00026 | 2.0×10⁻⁴ | −1.3 |
Resolving ε = 10−4, the smallest effect in the literature this instrument is built to test, needs about two days of continuous running at three standard errors and six at five, at the rate three modules give today.
The limits that go with those numbers. The control injects its bias at the capture input with the detector modules disconnected, which is the only way to know the injected size exactly — so it measures the instrument from the capture pin onward, and a source-in-the-loop qualification is still to come. The statistic cannot separate a change in event timing from a change in event rate, so rate structure at the 64-interval timescale would imitate a signal; the source’s own rate has been measured against that and shows nothing, but a detector in the field faces interference and disturbance that a bench does not.
Explore it yourself
The instrument, its records and the whole post-processing chain are public. There is one tool, one file, needing Python and nothing else for the checks and NumPy for the analysis.
qes verify— is this record the instrument’s, unaltered? Includes a self-test that flips a bit and shows you where it is caught, and where it is notqes export— turn a record into an event table and a per-second table of clock quality and environment, with a provenance file naming the source record and the signed byte rangeqes recompute— recover the published statistics from the raw bytes, measure the error bar by permutation, and sweep the rate confound across timescalesqes symbols— write the input for a NIST SP 800-90B entropy assessment, with the build recipe and a complete published run to check your numbers againstqes check— validate a record against the published record format, which is machine-readable and normative
The dataset holds signed positive-control records with everything derived from them, three hours of real decay, the clock stability measurement, and two entropy assessments including one run deliberately against ourselves. Start anywhere:
- Records and test vectors — CC BY 4.0
- Tool — MIT, one file
- Record format — field by field, with worked byte-level examples
- Signing root — the key that certifies which instruments are ours
If something here does not reproduce, we would like to know.